Part 1 - Hand Calculations of Data
Definitions:
Range – The difference between the highest value and
the lowest value in the dataset.
Mean (average) – The sum of all the observations divided
by the total number of observations.
Median – If each observation was listed in order from
least to greatest, the median is the observation
in the middle, or halfway in
the list.
Mode – The value that occurs the most.
Kurtosis – Refers to how steep or flat the
distribution of the data is. In other
words, kurtosis describes if the data is bunched together around one value or
if it is spread out among a broader range of values. Positive kurtosis (leptokurtic) means the
distribution is peaked. Negative
kurtosis (platykurtic) means the distribution is flat.
Skewness – Describes how evenly distributed the data
is on either side in relation to the mean.
Acceptable skewness is typically between -1 and 1, with 0 being no
skewness.
Standard Deviation – A statistic that describes how
closely the observations are distributed to the mean of the data. About 68% of the data will fall within 1
standard deviation from the mean. About 95%
of the data will fall within 2 standard deviations from the mean. About 99% of the data will fall within 3
standard deviations from the mean. This
statistic varies in different datasets because the data and number of
observations varies, but the 1st, 2nd, and 3rd
deviations will always fall approximately within the 68%, 95%, and 99% ranges.
Team ASTANA
Range: 70 min (1 hour 10 min)
Mean: 2276.667 min (37 hours 56.4 min)
Median: 2280 min (38 hours)
Mode: 2270 min and 2280 min (37 hours 50 min & 38 hours)
Kurtosis: 1.168
Skewness: -0.00257
Standard Deviation: 17.211 min
Team TOBLER
Range: 31 min
Mean: 2285.467 min (38 hours 5.4 min)
Median: 2289 min (38 hours 9 min)
Mode: 2289 min (38 hours 9 min)
Kurtosis: 2.927
Skewness: -1.5635
Standard Deviation: 7.891 min
When looking at the race data from each team, it is apparent
that the safe choice would be to invest in Team ASTANA. Not only does Team ASTANA have the three
fastest racers, but they also have a team average time that is faster than Team
TOBLER by 9 minutes. We can see that
Team TOBLER has a smaller range and a much lower standard deviation, meaning
there are no riders that are much faster or much slower than the rest of the
team. Though Team TOBLER has a solid group
of riders that are all relatively fast, they don’t seem to have much of a
chance at clinching 1st place for both the individual and team
categories.
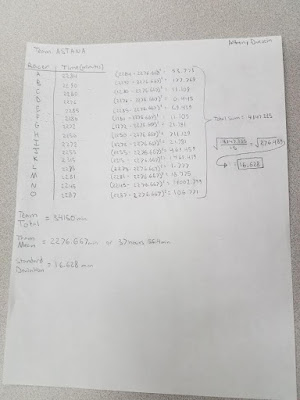
Figure 1 shows the calculations made by hand for the standard deviation for Team ASTANA and Figure 2 shows the calculations made by hand for the standard deviation for Team TOBLER.
 |
| Figure 1 |
 |
| Figure 2 |
Part 2 - Calculating Mean Centers and Weighted Mean Centers
 |
| Figure 3 |
The three points mapped in Figure 3 are the geographic mean center of Wisconsin, the weighted geographic mean center of Wisconsin based on population from the years 2000 and 2015. The geographic mean center of Wisconsin simply takes the shape of Wisconsin as a whole and finds the center of it. The weighted geographic mean center of Wisconsin based on population is calculated using data that represents population spatially and in concentrations, and a center point is calculated based on that data. The weighted geographic mean center of population shows that most people live in Southeastern Wisconsin, compared to the geographic mean center for the entire state. The shift in population centers shows that more people are living in Western Wisconsin in 2015 than 2000. There are several possible causes of this slight migration, or shift in population from east to west. It could be possible that cities in Western Wisconsin are expanding and becoming more economically promising. It could also be possible that suburbs of Milwaukee are expanding, meaning that populations wouldn't be based to the extreme southeast corner of Wisconsin, but just a little further west. Whatever the root cause of this geographic population shift, it will be interesting to see where the weighted geographic mean center based on population changes for Wisconsin in the next 15 years and beyond.
No comments:
Post a Comment